
Wading through masses of data can be confusing and time consuming unless the information is presented in a manner which is easily understood and easily actioned. Only a cursory search will bombard uncover hundreds of potential Key Performance Indicators (KPIs) that are monitored across varying degrees of frequency. KPIs for big companies and small companies, customer service and IT support, staff
performance and service level performance, availability vs down-time, and on and on.
The Service Desk is no exception and over time a wide variety of important Key Performance Indicators (KPIs) have evolved based on industry best practices such as ITIL.
Introducing Sunrise Wallboard
Sunrise Wallboard is a web-based portal for consolidated viewing of critical Key Performance Indicators (KPIs) providing real-time visibility over the whole Service Desk, and a visual early warning of potential issues that require additional scrutiny or escalation.
Sunrise Wallboard seamlessly complements your existing Sunrise Service Desk implementation bringing a wide variety of information together within a single portal making it both accessible and easily digestible. By visualising data with stunning charts including pie, doughnut, column, bar, line, area, bubble and funnels as well as gauges, Pareto or Marimekko charts, organisations are able to continually monitor performance and progress against the agreed goals that the Service Desk team work towards together.
Measure trends across the whole Service
Management lifecycle:
A wide variety of information can be communicated by a single Wallboard with each containing one or more pages, and with each page having one or more charts being displayed using configurable page layouts. Out of the box Sunrise Wallboard supplies comprehensive metrics across four distinct configurations.
Service Desk:
The Service Desk Wallboard presents quantitative charts focused on current performance against averages across time periods, types of Incidents and Service Requests. This Wallboard is designed to present the current situation in such a way to motivate
the Service Desk both as a team and individually.
Service Management:
The Service Management Wallboard is targeted at the needs of service, problem and change managers, providing an overview of how the Services delivered by the organisation are performing against Service Level Agreements (SLA’s) and how they
are impacted by current events. The health of the infrastructure can be gauged through this wallboard with use of Red, Amber and Green (RAG) rating for easily visualising the metrics at risk.
CIO:
The CIO Wallboard provides a high level view of the health of the Services provided by the organisation, aggregating a number of metrics according to ITIL discipline and applying a RAG rating to highlight both services and processes that are currently at risk. In
addition customer survey metrics provide information highlighting what the customers think about the provided services.
Customer:
The Customer Wallboard is designed to present high-level performance information around availability and service level statistics that the Service Desk would like to share with the organisation.
Sunrise Wallboard is not just a “one-size-fits-all” approach, it easily allows company-specific configuration of charts and data sources to address additional metrics, you can even extend beyond the Service Desk to support external applications using Microsoft SQL Server, Oracle or MySQL databases, such as financial, sales and asset discovery tools, or even the humble spreadsheet. Create additional Wallboards using the extensive ITIL-specific KPI library provided, allowing different Service Management groups to monitor whether they are operating within expected parameters. Businesses are able to monitor performance in a single location, ensuring that decisions can be made more confidently and quickly, using accurate and upto-date information relevant to the organisation. Access to Wallboards is via traditional desktop PC internet browsers or via tablet devices such as iPads.
The benefits of measuring Service Desk KPIs with Sunrise Wallboard:
• A comprehensive library of your KPI’s provides visual feedback to both users and managers, enabling you to focus on the important things, while it monitors the rest.
• A simple and effective web-based solution
• Improved decision making and efficiency
• Organisation-specific Service Desk metrics
• Visibility over core Service Desk operational Key Performance Indicators
• Proactive management of resources based on up-tothe-minute utilisation information SSAE-16 compliant datacentre
• Public or secure access to performance related information – users only see the information they need to see
• Visual Service Desk metrics critical to your organisation
• Out-of-the-box content for fast implementation
• Sunrise Wallboard can even be styled to meet an organisation’s corporate brand guidelines.
With Sunrise Wallboard you can proactively monitor agent workloads, identify service level trends, benchmark current performance against previous months or years, and monitor the perception of the quality of your service through customer surveys.
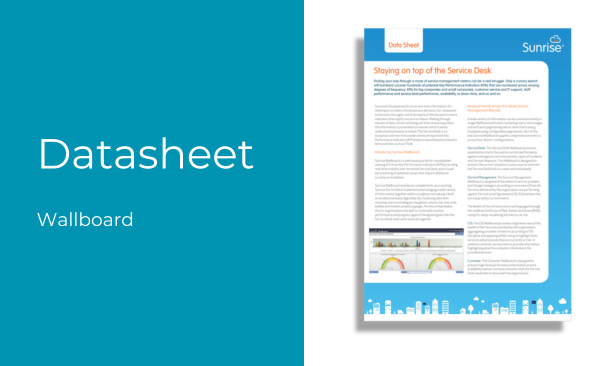
For more information on the Sunrise Wallboard, download the Data Sheet.
The datasheet includes:
- An overview of Wallboard
- What’s included
- The benefits of using Wallboard
.svg)


-1.png "__img-people (1)-1")
